Graphs asked in PTE Academic
Types of Graphs provides in-depth information about charts & graphs. Graphs are used in a variety of ways, and almost every industry, such as engineering, search engine optimization, mathematics, and education.If you cannot find the information you are looking for, do feel free to let us know and we will make sure to work on expanding the content to cover the topic of graphs in a more comprehensive manner.
Line Graphs

Comparing various sets of data can be complicated, but line graphs make it easy. The plotted peaks and dips on the grid allow you to monitor and compare improvement and decline. Line graphs are most often used by scientists, professionals and students.
Bar Graphs

Pleasing to the eyes, bar graphs compare data in a simple format consisting of rectangular bars. With a few varieties to choose from, settling on the right bar graph might be confusing. Should you go with a horizontal, vertical, double or group bar graph? Read on to find out.
Pie Charts

Simple to make and simple to understand, a pie chart is a popular form of data comparison, consisting of a circle that is split into parts. When should you use pie charts, and when should you not? Learn about their advantages and disadvantages, and get some tips on making pie charts.
Organizational Charts

These diagrams represent the relationships between the different positions and ranks of a company through a series of boxes (top to bottom and side to side). Not only does an organizational chart add order and structure to an organization, but it also shows if changes are needed. Get more information on organizational charts.
Flowcharts

When projects seem overbearing and processes seem complex, flow charts can save the day by break things down into smaller steps and giving you a clearer idea of the overall process. Shapes are typically used to represent the components of a flow chart. Find out what these shapes represent and learn more about flow charts.
Venn Diagram

Maps
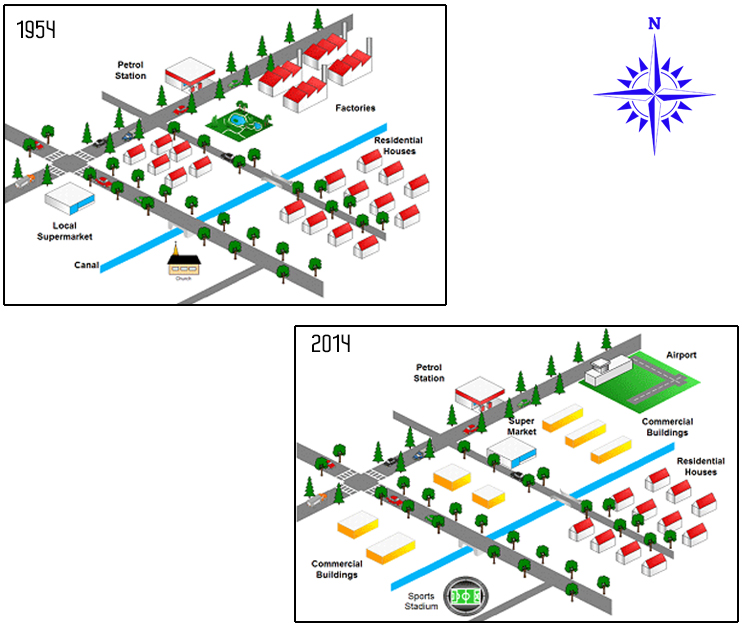
A diagrammatic representation of an area of land or sea showing physical features, cities, roads, etc.
Tables

A table is a set of data arranged in rows and columns.
Tornado Chart
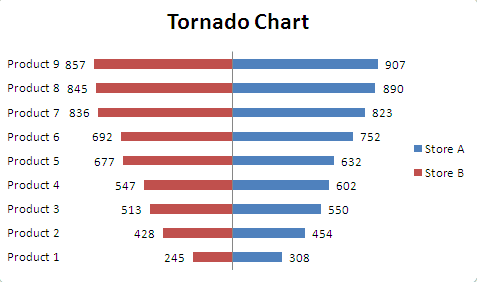
Image
Statistical Vocabulary to Describe graphs
